Stupidly Simple Plain Text Running Log
Posted on 7th of November 2025I’ve recently started revitalize my running hobby. Mainly due to the fact that
I’ve gathered up some extra “unnecessary” kilos, so I’ve felt that I need to
step up my aerobic exercises. Although, truth be told, I’ve never been too keen
into that sort of exercises and have always preferred stuff like strength
training etc. But I think now would be good time to start.
Of course, being the geek I am, I wanted to start tracking my practice in one
form or another. Obviously, something like Strava is a
very common solution for this and most likely if I end getting more “hooked” on
this hobby, I’ll probably start using it more. But at the same time, I kinda
would want to have something self-hosted for this, at least for sharing these to
others.
I’ve always been a fan of “Plain Text X” type of solutions. Great example would
be something like Plain Text Accounting,
where something like Ledger is a commonly
used software. So naturally, I wanted to have something similar for my running
log.
For this purpose, I decided to go with a simple CSV file and
gnuplot. Considering, one of the reasons why I wanted
to do this was to be able to share these. So naturally, something like HTML
table and JS chart library could’ve done the trick. But at the same time, I
kinda wanted to have some non-JS solution.
I decided to go with very simple structure for logging my runs. Essentially, I
only cared about the date of the run, the length of the run and also the ability
to give few words of notes about the run. In CSV, it could look something like:
date,distance_km,notes
2025-11-01,5.2,Morning jog
2025-11-03,7.5,Evening run
2025-11-05,10.0,Long run with hills
Adding new runs would also be simple as you can just manually edit the file or
run something like:
echo "2025-11-06,6.3,Easy recovery run" >> runs.csv
Also if someone cares about this, in this format, it’s also easily
version-controllable e.g. in Git.
Plotting the Runs
To get the plotting started, I just started with something simple:
set datafile separator comma
set xdata time
set timefmt "%Y-%m-%d"
set format x "%m-%d"
set title "Running Distance Over Time"
set xlabel "Date"
set ylabel "Distance (km)"
set grid
set term pngcairo size 800,400
set output "runs.png"

plot "runs.csv" using 1:2 with linespoints title "Distance (km)" lw 2
and creating the plot itself:
$ gnuplot plot.gp
With the data defined above, it would result into something like this:
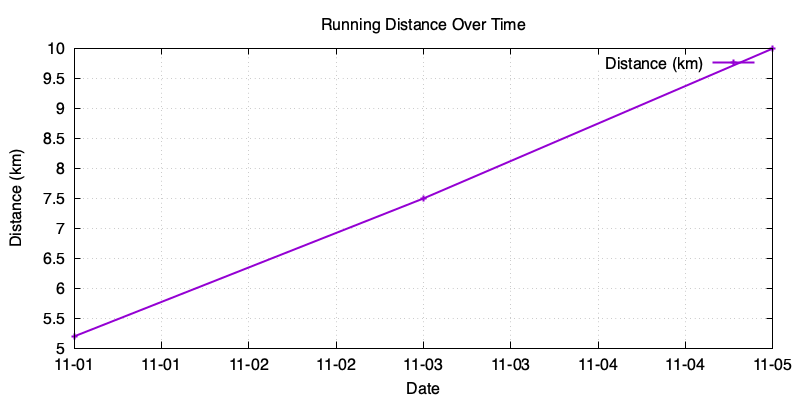
Of course, gnuplot offers a wide variety of different configurations for these
plots, so you can go nuts with them. But at least for me, this is a good
starting point.
Creating a Static Page for the Running Log
Lastly, I just wanted to generate some sort of HTML page from it, that I can
just save to my server. I decided to just read through the CSV file and just
create a HTML table out of that in a simple shell script format.
#!/usr/bin/env bash

# Generate chart
gnuplot plot.gp

# Start HTML
cat > index.html <<EOF
<!doctype html>
<meta charset="utf-8">
<title>Running Log</title>
<style>
  table { width: 100%; border-collapse: collapse; }
  th { text-align: left; }
  th, td { border: 1px solid; padding: 0.4em; }
  img { display:block; margin:auto; max-width:100%; }
</style>
<h1>Running Log</h1>
<figure>
  <img src="runs.png" alt="Running chart" style="">
</figure>
<table>
  <tr><th>Date</th><th>Distance (km)</th><th>Notes</th></tr>
EOF

# Convert CSV rows to HTML table rows (skip header)
tail -n +2 runs.csv | while IFS=, read -r date dist note; do
  echo "  <tr><td>$date</td><td>$dist</td><td>$note</td></tr>" >> index.html
done

# End HTML
cat >> index.html <<EOF
</table>
EOF
And yes, that is a valid HTML, since you can omit optional tags in
HTML5.
If you happen to want to show the table so that it shows the most recent entry
first, which is most likely the case, you can just include tac in the while
loop:
# Convert CSV rows to HTML table rows (skip header)
tail -n +2 runs.csv | tac | while IFS=, read -r date dist note; do
  echo "  <tr><td>$date</td><td>$dist</td><td>$note</td></tr>" >> index.html
done
And there it is! Intentionally (or stupidly) simple. Only depedency being
gnuplot. All data in simple plain text format, published in HTML. Of course,
there are plenty of improvements that could be made like weekly/monthly
summaries (this could be easily done with awk) or just creating different
plots from the given data.
Using Hugo
If you happen to be using Hugo, you can read CSV directly and create a new
shortcode for generating similar table as above. You can read more about that in
here
I’ve also started to gather up my own runs in here in case you
happen to be interested in how much I struggle with this new hobby.